Author:
Australian Institute of Health and Welfare
Released:
17 July 2026
Topic:
Cat. no:
GEN 001
Summary
Quality Indicators (QIs) measure aspects of service provision that contribute to the quality of care given by residential care homes (RCH). Participation in the National Aged Care Quality Indicator Program (QI Program) has been a requirement for all Australian Government subsidised RCH since 1 July 2019. Data under the QI Program are collected and reported by RCH quarterly.
This quarterly report includes QI measurements from data collected from 1 January to 31 March 2026 for 2,509 RCH conducted under the QI Program (National Aged Care Quality Indicator Program Manual). These RCH are those that had received Australian Government subsidies for delivering care, services, and accommodation in that period; and had submitted QI data by the submission due date (21 April 2026) up to the date of data extraction. QI and occupied bed days (OBD) data processing, checking, and preparing the data for transfer was completed by the Department of Health, Disability and Ageing between the submission and extraction dates, and was supplied to the Australian Institute of Health and Welfare (AIHW) on 11 May 2026. Quarterly Financial Report (QFR) data related to three staffing QIs was supplied to the AIHW on 11 May 2026.
Available data represented 99.5% of the 2,522 RCH that received government subsidies in the quarter (based on occupied bed days data extracted on 11 May 2026). Further detail on the resident coverage of the QI Program in this quarter, including counts of resident measurements and exclusions for each QI, is presented in Table S1 of the Technical notes.
Definitions of quality indicators
The pressure injuries QI captures information about percentage of residents with pressure injuries. A pressure injury is a localised injury to the skin and/or underlying tissue usually over a bony prominence, because of pressure, shear, or a combination of these factors. Assessment of pressure injuries in eligible residents is made on or around the same time and day in each quarter of the year. This can be done as part of the resident’s usual personal care. Consent is sought from residents before a full-body observation assessment is undertaken.
Eligible residents with one or more pressure injuries are reported against each of the six pressure injury stages:
- Stage 1 pressure injuries: intact skin with non-blanchable redness of a localised area
- Stage 2 pressure injuries: partial-thickness skin loss presenting as a shallow open ulcer with a red/pink wound bed
- Stage 3 pressure injuries: full-thickness skin loss, no exposure of bone, tendon or muscle
- Stage 4 pressure injuries: full-thickness loss of skin and tissue with exposed bone, tendon or muscle
- Unstageable pressure injuries: full-thickness skin tissue loss in which the base of the injury is covered by slough (yellow, tan, grey, green or brown) and/or eschar (tan, brown or black)
- Suspected deep tissue injuries: purple or maroon localised area of discoloured intact skin or blood-filled blister due to damage of underlying soft tissue from pressure and/or shear.
Additional reporting: Eligible residents with pressure injuries that were acquired outside of the home during the quarter are counted separately but are still included in the total number of residents reported as having pressure injuries.
The restrictive practices QI captures information about percentage of residents who were subject to the use of a restrictive practice. The Quality of Care Principles 2014 (Quality of Care Principles – as amended; compilation in force October 2025) define restrictive practices as any practice or intervention that has the effect of restricting the rights or freedom of movement of a resident.
Restrictive practices QI measures and reports data relating to all restrictive practice, excluding chemical restraint. This includes physical restraint, mechanical restraint, environmental restraint, and seclusion.
It is a legal requirement for RCH to document all instances of restrictive practice (see Part 4A of the Quality of Care Principles). For this QI in each quarter, three days of existing records for all eligible residents at a home are assessed for any instances of restrictive practice (excluding chemical restraint). This QI is therefore a measure of the use of restrictive practices across the three-day period only. This three-day period is selected and recorded by homes but must be varied each quarter and not known to the staff directly involved in care.
Restrictive practices are still recorded even if a resident or their representative has provided consent to the use of the restrictive practice.
Additional reporting: Eligible residents who were subject to the use of a restrictive practice exclusively through the use of a secure area are counted separately but are still included in the total number of residents who were subject to the use of a restrictive practice.
The unplanned weight loss QI captures information about percentage of residents who experienced unplanned weight loss. Weight loss is considered to be unplanned where there is no written strategy and ongoing record relating to planned weight loss for the resident. Eligible residents are weighed each month around the same time of the day and wearing clothing of a similar weight (e.g., a single layer without coats or shoes). Consent is sought from residents before an assessment on their body weight is undertaken.
This QI includes two categories:
- Significant unplanned weight loss: Eligible residents who experienced significant unplanned weight loss of 5% or more when comparing their current and previous quarter finishing weights
- Consecutive unplanned weight loss: Eligible residents who experienced consecutive unplanned weight loss every month over three consecutive months of the quarter.
The falls and major injury QI captures information about percentage of residents who experienced one or more falls and who experienced a fall resulting in major injury. A fall is an event that results in a person coming to rest inadvertently on the ground or floor or other lower level. For a fall to meet the criteria of resulting in a major injury, the fall must result in one or more of the following: bone fractures, joint dislocations, closed head injuries with altered consciousness and/or subdural haematoma. Assessment for falls and major injury is conducted through a single review of the care records of each eligible resident for the entire quarter.
This indicator includes two categories:
- Falls: Eligible residents who experienced a fall (one or more) at the home during the quarter
- Falls that resulted in major injury: Eligible residents who experienced a fall at the home, resulting in major injury (one or more), during the quarter.
The medication management QI captures information about percentage of residents who were prescribed nine or more medications (polypharmacy) and percentage of residents who received antipsychotic medications. Assessment for polypharmacy is conducted through a single review of medication charts and/or administration records for each eligible resident for a collection date selected by the home every quarter. For antipsychotics, a seven-day medication chart and/or administration record review is conducted for each eligible resident every quarter.
This indicator includes two categories:
- Polypharmacy: Eligible residents who were prescribed nine or more medications as at the collection date in the quarter
- Antipsychotics: Eligible residents who received an antipsychotic medication during the seven-day assessment period in the quarter.
Additional reporting: Eligible residents who received an antipsychotic medication for a diagnosed condition of psychosis are counted separately but are still reported in the total number of residents who received an antipsychotic medication.
The activities of daily living QI captures information about percentage of residents who experienced a decline in activities of daily living. Activities of daily living indicate a person’s ability to move and care for themselves, and include management of personal hygiene, dressing, going to the toilet, and eating.
Assessment for activities of daily living is conducted using the Barthel Index of Activities of Daily Living (ADL assessment), a 10-item questionnaire completed by a staff member for each eligible resident once per quarter using existing knowledge, care records, direct observation, and talking to the resident. The timing of measurement is chosen at the discretion of individual homes but is recommended to occur around the same time each quarter. The ADL assessment reflects the resident’s performance in the 24-48 hours prior to the assessment.
The total score on the current quarter ADL assessment is compared to the total score on the previous quarter’s ADL assessment. A decline in ADL assessment is defined as a decline of one or more points from the previous quarter to the current quarter.
Eligible residents who received a ‘zero’ score (indicating dependence in all areas) on both the previous quarter and the current quarter are included in the total number of people assessed for this QI.
Additional reporting: Residents with an ADL assessment total score of zero in the previous quarter.
The incontinence care QI captures information about percentage of residents who experienced incontinence associated dermatitis. Incontinence is the loss of bladder and bowel control and can lead to incontinence associated dermatitis (IAD).
Incontinence care is assessed using the Ghent Global IAD Categorisation Tool, which categorises IAD severity based on visual inspection of the affected skin areas. Assessment is conducted by a staff member for each eligible resident once per quarter, around the same time each quarter. The timing of measurement is chosen at the discretion of individual homes.
Eligible residents with incontinence are recorded. Additionally, eligible residents who experience IAD are reported against each of the four sub-categories:
- 1A: Persistent redness without clinical signs of infection
- 1B: Persistent redness with clinical signs of infection
- 2A: Skin loss without clinical signs of infection
- 2B: Skin loss with clinical signs of infection.
The proportion of residents meeting criteria for IAD is calculated only for those who are recorded with incontinence.
The hospitalisation QI captures information about percentage of residents who had one or more emergency department presentations or hospital admissions. Emergency department presentations and hospital admissions are potentially preventable if residents have timely access to appropriate healthcare services.
Assessment for hospitalisation is conducted through a single review of care records for each eligible resident over the entire quarter.
The QI includes two categories:
- Emergency department presentations: Eligible residents who had one or more emergency department presentations during the quarter
- Emergency department presentations or hospital admissions: Eligible residents who had one or more emergency department presentations or hospital admissions during the quarter.
The workforce QI captures information about percentage of staff turnover. Registered providers of residential care homes report the number of staff working in defined roles over the entire quarter.
The defined roles to be reported are:
- Service managers
- Nurse practitioners or registered nurses
- Enrolled nurses
- Personal care workers or nursing assistants.
Registered providers report workforce data in three steps:
- Staff who worked any hours in each of these roles in the previous quarter
- Of those recorded at Step 1, staff employed in each of these roles at the start of the current quarter (i.e. those who worked at least 120 hours in the previous quarter)
- Of those recorded at Step 2, staff who stopped working in each of these roles during the current quarter (i.e. those with a period of at least 60 days in the current quarter in which they did not work).
This QI is the number and proportion of care staff in each category who stopped working for the provider between quarters, as an indicator of workforce turnover.
The consumer experience QI captures information about percentage of residents who report ‘good’ or ‘excellent’ experience of the home. The consumer experience QI captures the resident’s rating of six key attributes of care quality: respect and dignity, supported decision-making, skills of aged care staff, impact on health and wellbeing, social relationships and community connection, and confidence in lodging complaints.
Assessment for consumer experience is conducted using the Quality of Care Experience-Aged Care Consumers instrument, a 6-item questionnaire completed by the eligible resident (where possible) or a person who knows them well and sees them regularly (where the resident is unable to answer on their own behalf due to cognitive impairment). ‘Self-completion’ is when a resident independently completed the questionnaire, while ‘interviewer facilitated completion’ is when a resident is assisted to complete the questionnaire (i.e. by reading out the questions and response options) by an interviewer. The interviewer may or may not be a staff member at the home. Proxy-completion is when the questionnaire is completed by a family member, informal carer, or formal carer who knows the resident well.
Assessment occurs once per quarter, around the same time each quarter. The timing of measurement is chosen at the discretion of individual homes.
Responses are categorised as:
- Excellent consumer experience: where a resident scores between 22–24
- Good consumer experience: where a resident scores between 19–21
- Moderate consumer experience: where a resident scores between 14–18
- Poor consumer experience: where a resident scores between 8–13
- Very poor consumer experience: where a resident scores between 0–7.
The QI is the number and proportion of residents who rated their consumer experience as ‘Good’ or ‘Excellent’.
The quality of life QI captures information about percentage of residents who report ‘good’ or ‘excellent’ quality of life. The quality of life QI captures the resident’s perception of their position in life taking into consideration their environment, goals, expectations, standards, and concerns. Assessment examines independence, mobility, pain management, emotional wellbeing, social relationships, and leisure activities / hobbies.
Assessment for quality of life is conducted using the Quality of Life – Aged Care Consumers instrument, a 6-item questionnaire completed by the eligible resident themselves or via an interviewer (where possible) or a person who knows them well and sees them regularly (where the resident is unable to answer on their own behalf due to cognitive impairment). ‘Self-completion’ is when a resident independently completed the questionnaire, while ‘interviewer facilitated completion’ is when a resident is assisted to complete the questionnaire (i.e. by reading out the questions and response options) by an interviewer. The interviewer may or may not be a staff member at the home. Proxy-completion is when the questionnaire is completed by a family member, informal carer, or formal carer who knows the resident well.
Assessment occurs once per quarter, around the same time each quarter. The timing of measurement is chosen at the discretion of individual homes.
Responses are categorised as:
- Excellent quality of life: where a resident scores between 22–24
- Good quality of life: where a resident scores between 19–21
- Moderate quality of life: where a resident scores between 14–18
- Poor quality of life: where a resident scores between 8–13
- Very poor quality of life: where a resident scores between 0–7.
The QI is the number and proportion of residents who rated their quality of life as ‘Good’ or ‘Excellent’.
The enrolled nursing QI captures information about proportion of care minutes provided to residents over the quarter by enrolled nurses. Registered providers report care minutes data that enables calculation of the following enrolled nursing QIs:
- Proportion of EN care minutes: EN care minutes reported as a percentage of total care minutes. Total care minutes per resident per day (denominator) is the sum of care minutes per resident per day of EN, registered nursing (RN), and personal care workers or nursing assistants (PCW/NA).
- Proportion of nursing care minutes: Proportion of combined EN and RN care minutes per resident per day over total care minutes per resident per day. Total care minutes per resident per day (denominator) is the sum of care minutes per resident per day of EN, RN, and PCW/NA.
Registered providers are not required to submit data for the enrolled nursing QI through QI Program reporting in the Government Provider Management System. The Department extracts the data needed to calculate this QI from data submitted through the Quarterly Financial Report.
The allied health QI captures information about care minutes and recommended allied health services received by residents over the quarter. Registered providers report allied health data that enables calculation of the following allied health QIs:
- Allied health care minutes: reported as the average allied health care minutes per resident per day. Registered providers are not required to submit data for the allied health care minutes QI through the QI Program reporting in the Government Provider Management System. The Department extracts the data needed to calculate this QI from data submitted through the Quarterly Financial Report.
- Percentage of recommended allied health services received: the proportion of allied health services that were delivered to residents from those recommended in their care plan during the quarter.
Note: The registered providers only need to:
- Report once per discipline per resident. For example, if three dietetic appointments were recommended, this counts as one recommendation for dietetics for that resident.
- Report services received that were recommended. For example, if a resident has no recommendation for speech pathology but receives an appointment with a speech pathologist, the provider should not report this service for that resident.
Allied health professionals included in this QI are consistent with those reported as part of the Quarterly Financial Report and includes:
- physiotherapy
- occupational therapy
- speech pathology
- podiatry
- dietetics
- other allied health professionals (art therapists, audiologists, chiropractors, counsellors, diabetes educators, exercise physiologists, music therapists, osteopaths, psychologists, social workers)
- allied health assistant.
The lifestyle officers QI captures information about care minutes provided to residents over the quarter by lifestyle officers. Registered providers report care minutes data that enables calculation of the following lifestyle officers QI:
- Lifestyle officers care minutes: reported as average lifestyle officers care minutes per resident per day. Registered providers are not required to submit data for the lifestyle officers care minutes QI through QI Program reporting in the Government Provider Management System. The Department extracts the data needed to calculate this QI from data submitted through the Quarterly Financial Report.
Among the 14 QIs detailed in this report:
- Nine QIs (1–9) measure adverse events, complications, or undesirable outcomes. Lower values in these QIs may indicate better quality of care
- Five QIs (10–14) measure desirable outcomes relating to consumer experience, quality of life, enrolled nursing, allied health, and lifestyle officers. Higher values in these QIs may indicate better quality of care.
National data: variation over time
A trend analysis is conducted to examine variation over time in QI performance. For the trend analysis, data are pooled together for every eligible resident reported about in the quarter. Trends are examined based on sector level outcomes per quarter.
At each quarter, the number of residents who meet criteria for a QI is counted. These counts are then compared over time using a quasi-Poisson regression model. More detail about the quasi-Poisson regression model can be found in the Technical Notes.
The trend analysis included data from 19 quarters, from July–September 2021 to January–March 2026. Eleven QIs (1–11) are included in the trend analysis.
Regarding QIs that measure adverse events, complications, or undesirable outcomes (i.e., lower values of these QIs indicate better quality of care), results show that:
- Over time there has been a statistically significant decrease in the proportion of residents experiencing one or more pressure injuries, significant unplanned weight loss, consecutive unplanned weight loss, falls that resulted in major injury, polypharmacy, antipsychotic medication use, incontinence, and in the proportion of workforce turnover
- Over time there has been a statistically significant increase in the proportion of residents experiencing both ‘emergency department presentations’ and ‘emergency department presentations or hospital admissions’
- Over time there has been no statistically significant change in the proportion of residents experiencing restrictive practices, restrictive practice exclusively through the use of a secure area, total falls, a decline in their ADL score, or IAD.
Regarding QIs that measure desirable outcomes (i.e., higher values of these QIs indicate better quality of care), results show that:
- Over time there has been a statistically significant increase in the proportion of residents reporting ‘good’ or ‘excellent’ consumer experience and quality of life.
National data
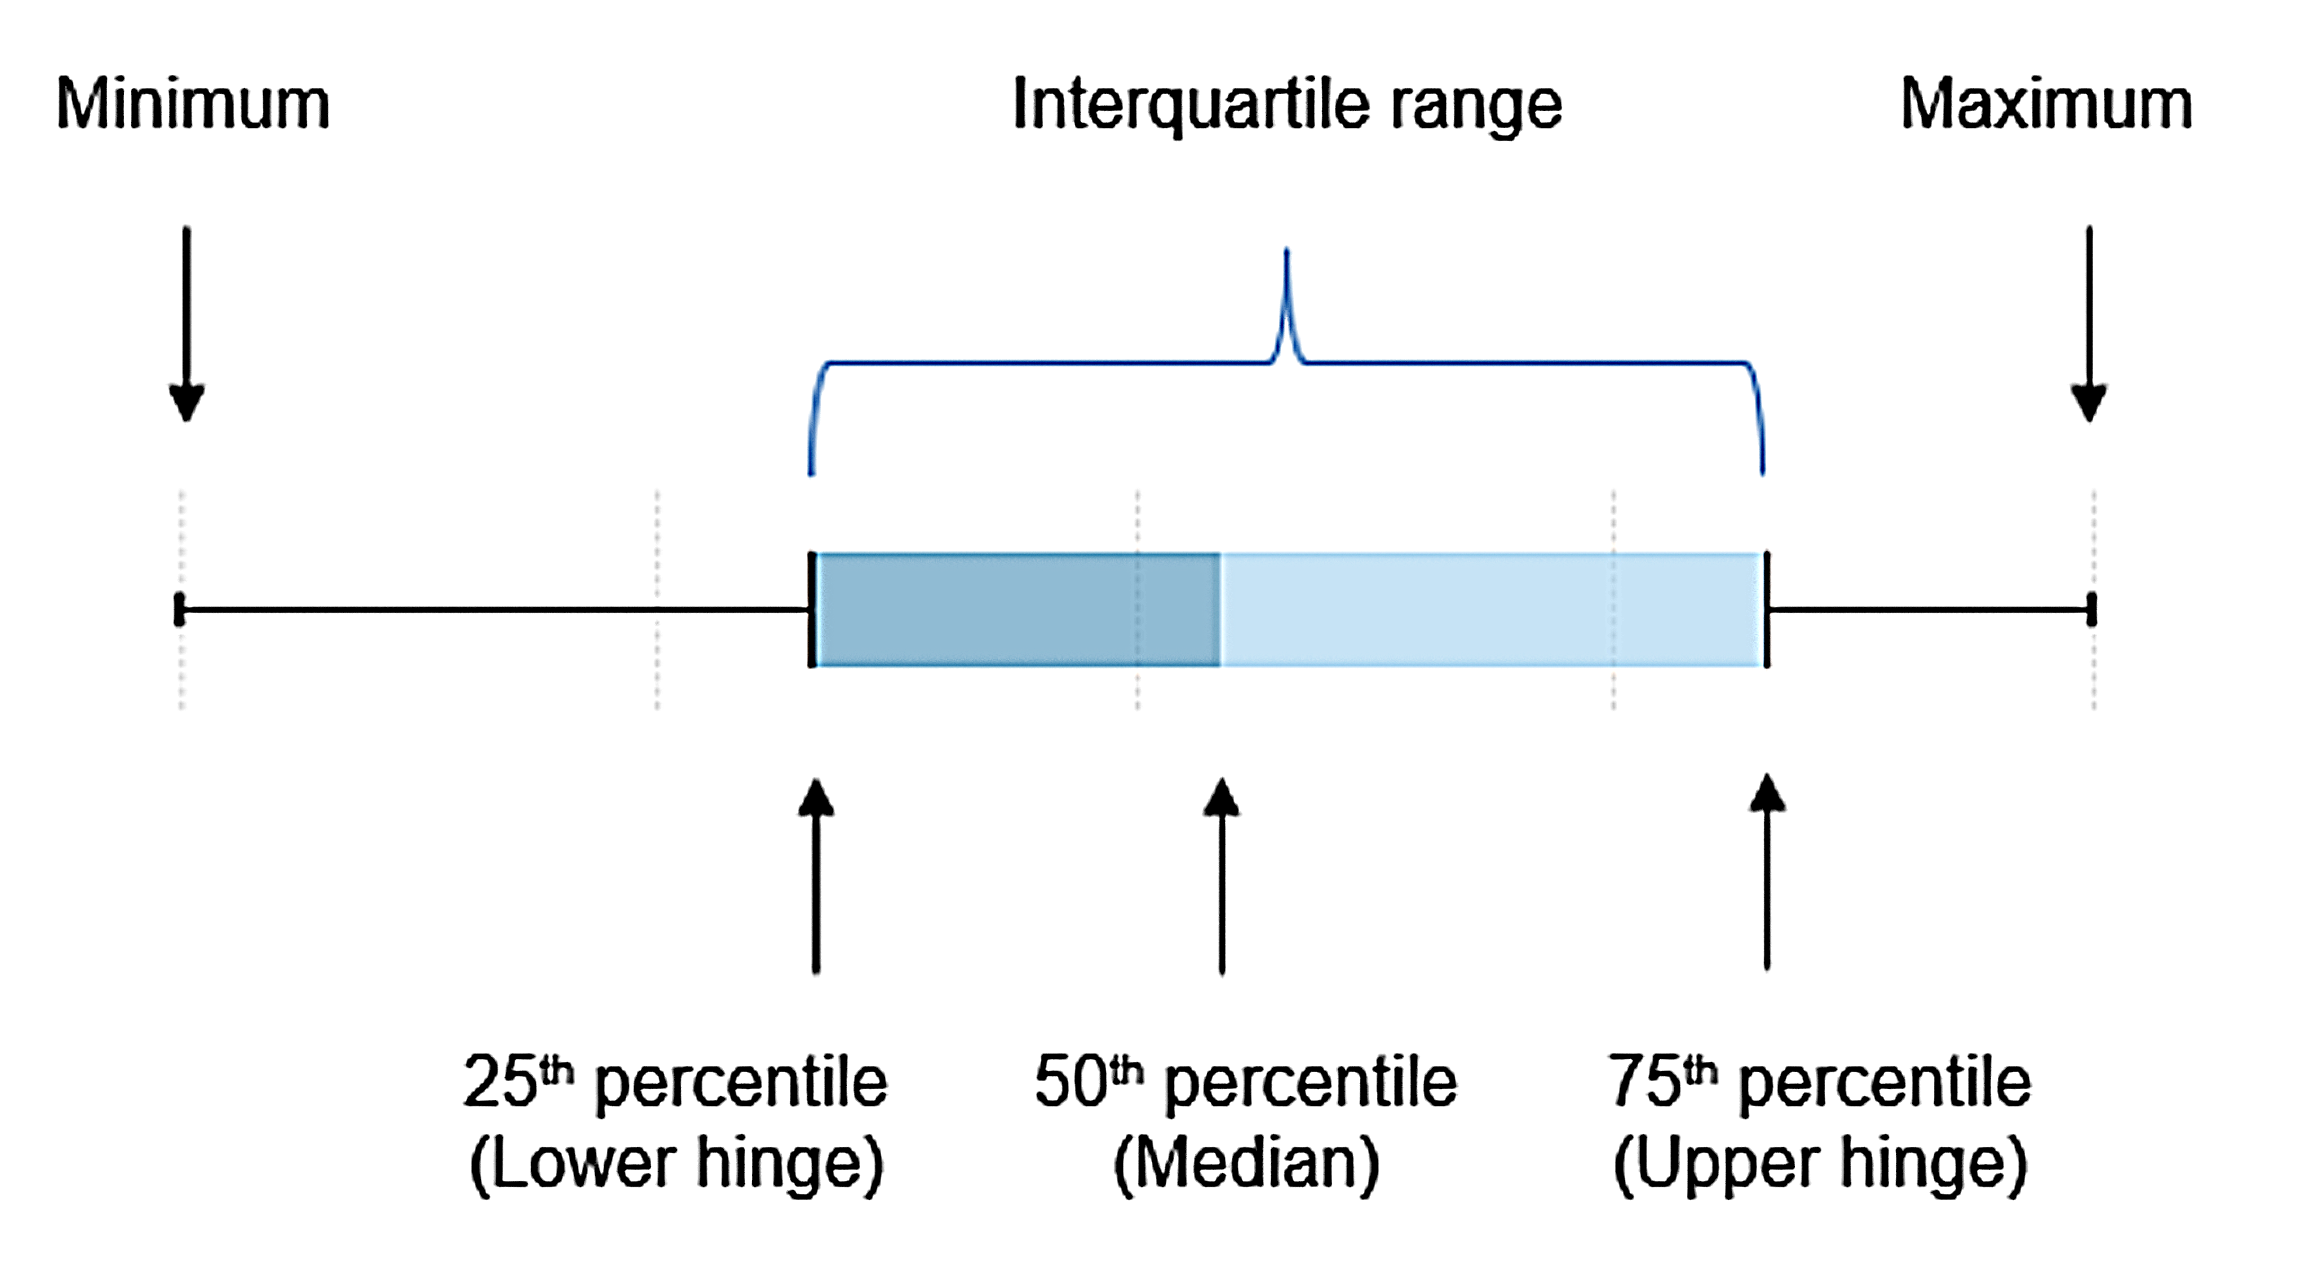
QI data are presented below at a national level. The table presents data for all eligible residents aggregated across all 2,509 included RCH. The boxplot that follows presents data for all eligible residents aggregated at the home level. For further information on boxplots, see ‘Interpreting boxplots’ below.
The values shown in the box plots are the minimum value, 25th percentile (‘Lower Hinge’), the 50th percentile (‘Median’), 75th percentile (‘Upper Hinge’) and the maximum value.
As an example of interpreting the percentiles, the 25th percentile shows at what QI prevalence rate 25% of the RCH reported a rate lower than this, and conversely 75% of the RCH reported a QI rate higher than this. The median value represents the QI prevalence rate in the middle of the values reported in Australia.
The interquartile range (IQR) is a measure of statistical dispersion or spread of QI rates and is the difference between the 75th percentile and the 25th percentile values.
.png)
Geographical variation
Disaggregations of QIs by state and territory and by remoteness categories were calculated from raw data with no risk adjustment. At the time of reporting, it is not possible to take into account variation in the complexity of resident’s care needs at the home level (case-mix) nor how this interacts with other features known to vary across geographical areas, such as home size, home ownership or interaction with healthcare services (such as hospitals and palliative care services).
Technical notes
Technical notes – 1 January to 31 March 2026
(PDF, 379 KB)
Previous releases
Residential Aged Care Quality Indicators – October to December 2025
(PDF, 1.0 MB)
Residential Aged Care Quality Indicators – October to December 2025 data tables
(XLSX, 326 KB)
Residential Aged Care Quality Indicators – July to September 2025
(PDF, 1.2 MB)
Residential Aged Care Quality Indicators – July to September 2025 data tables
(XLSX, 613 KB)
Residential Aged Care Quality Indicators – April to June 2025
(PDF, 2.1 MB)
Residential Aged Care Quality Indicators – April to June 2025 data tables
(XLSX, 627 KB)
Residential Aged Care Quality Indicators – January to March 2025
(PDF, 1.1 MB)
Residential Aged Care Quality Indicators – October to December 2024
(PDF, 800 KB)
Residential Aged Care Quality Indicators – July to September 2024
(PDF, 948 KB)
Residential Aged Care Quality Indicators – April to June 2024
(PDF, 868 KB)
Residential Aged Care Quality Indicators – January to March 2024
(PDF, 859 KB)
Residential Aged Care Quality Indicators – October to December 2023
(PDF, 1.8 MB)
Residential Aged Care Quality Indicators – July to September 2023
(PDF, 894 KB)
Residential Aged Care Quality Indicators – April to June 2023
(PDF, 646 KB)
Residential Aged Care Quality Indicators – January to March 2023
(PDF, 647 KB)
Residential Aged Care Quality Indicators – October to December 2022
(PDF, 486 KB)
Residential Aged Care Quality Indicators – July to September 2022
(PDF, 475 KB)
Residential Aged Care Quality Indicators – April to June 2022
(PDF, 438 KB)
Residential Aged Care Quality Indicators – January to March 2022
(PDF, 437 KB)
Residential Aged Care Quality Indicators – October to December 2021
(PDF, 664 KB)
Residential Aged Care Quality Indicators – July to September 2021
(PDF, 432 KB)
Residential Aged Care Quality Indicators – April to June 2021
(PDF, 264 KB)
Residential Aged Care Quality Indicators – January to March 2021
(PDF, 309 KB)
Residential Aged Care Quality Indicators – October to December 2020
(PDF, 1.5 MB)
Residential Aged Care Quality Indicators – July to September 2020
(PDF, 1.3 MB)
Residential Aged Care Quality Indicators – April to June 2020
(PDF, 533 KB)
Residential Aged Care Quality Indicators – January to March 2020
(PDF, 699 KB)
Residential Aged Care Quality Indicators – October to December 2019
(PDF, 970 KB)
Residential Aged Care Quality Indicators – July to September 2019
(PDF, 704 KB)
