Older Australians who use aged care services often have complex health needs that require support from the health care system. This includes seeing GPs or specialists, having medications dispensed to them, being admitted to hospital, or visiting an emergency department.
Last updated: 29 May 2026
New Aged Care Act
This page presents data from before the Aged Care Act 2024 came into effect on 1 November 2025. Changes since the commencement of the new Act and the beginning of the Support at Home program, alongside a new regulatory model, will be reported when data become available. For more information on the new Act, see New Aged Care Act on the Department of Health, Disability and Ageing website.
Overview
Understanding the patterns of health service use by people using aged care is important for improving services and outcomes across both systems.
This page focuses on health services accessed by people aged 65 and over receiving permanent residential care, home care or no aged care services during 2023–24 using linked data from the National Aged Care Data Asset (NACDA). Specifically:
- use of Medicare-subsidised services for GP, specialist attendances and other services
- prescription medicines dispensed under the Pharmaceutical Benefits Scheme (PBS) or Repatriation Pharmaceutical Benefits Scheme (RPBS)
- hospitalisations and emergency department presentations in public hospitals for people in New South Wales, Victoria, Queensland, Tasmania and Australian Capital Territory
- trends in use of the above health services over the period 2021–22 to 2023–24
The data presented here do not capture all health care received by people using aged care – for example, some services are directly reimbursed via Department of Veterans’ Affairs arrangements – but they do allow us to explore usage patterns for certain types of mainstream health services. The data reported reflect patterns of service use only, not the appropriateness or quality of the care delivered.
The AIHW is undertaking a project using linked data in the NACDA to investigate the issue of delayed discharge of older patients (DDOP) from hospital and the interface with aged care services. The project is investigating ways to define DDOP and patterns/trends at the national level over time. It is further examining the interaction of DDOP hospital stays with regards to timing of aged care service approvals and aged care service access and use, and describing the characteristics of these older people.
The DDOP hospital and aged care pathway analysis is also informing policy dialogue on how best to define, measure and report on DDOP, including informing work towards the development of nationally consistent data.
Profile of the study population
This analysis compares the characteristics and patterns of health service use for 3 aged care user groups (study population):
- permanent residential care – all people aged 65 and over living permanently in a residential aged care facility at any point between 1 July 2023 and 30 June 2024
- home care – all people aged 65 and over living in the community who received home-based care and support through the Home Care Packages Program at any point between 1 July 2023 and 30 June 2024
- no aged care – a comparison group of a sample of people aged 65 and over who did not use any aged care services between 1 July 2023 and 30 June 2024
These groups only include people who were alive and aged 65 and over in July 2023.
The ‘no aged care’ group consists of a sample of people from the general population who were matched by an index of age and sex to the aged care recipient groups. People were excluded from this group if they used any government-funded aged care services including the Commonwealth Home Support Program (home support), flexible care or residential respite care.
People can enter and exit aged care at any point in time, and can use different types of aged care services. Although people do not receive permanent residential care and home care at the same time, some people will access both of these aged care service types over the course of a year. To account for this, health service use is counted in this analysis only for the period of time each person receives a certain aged care service type.
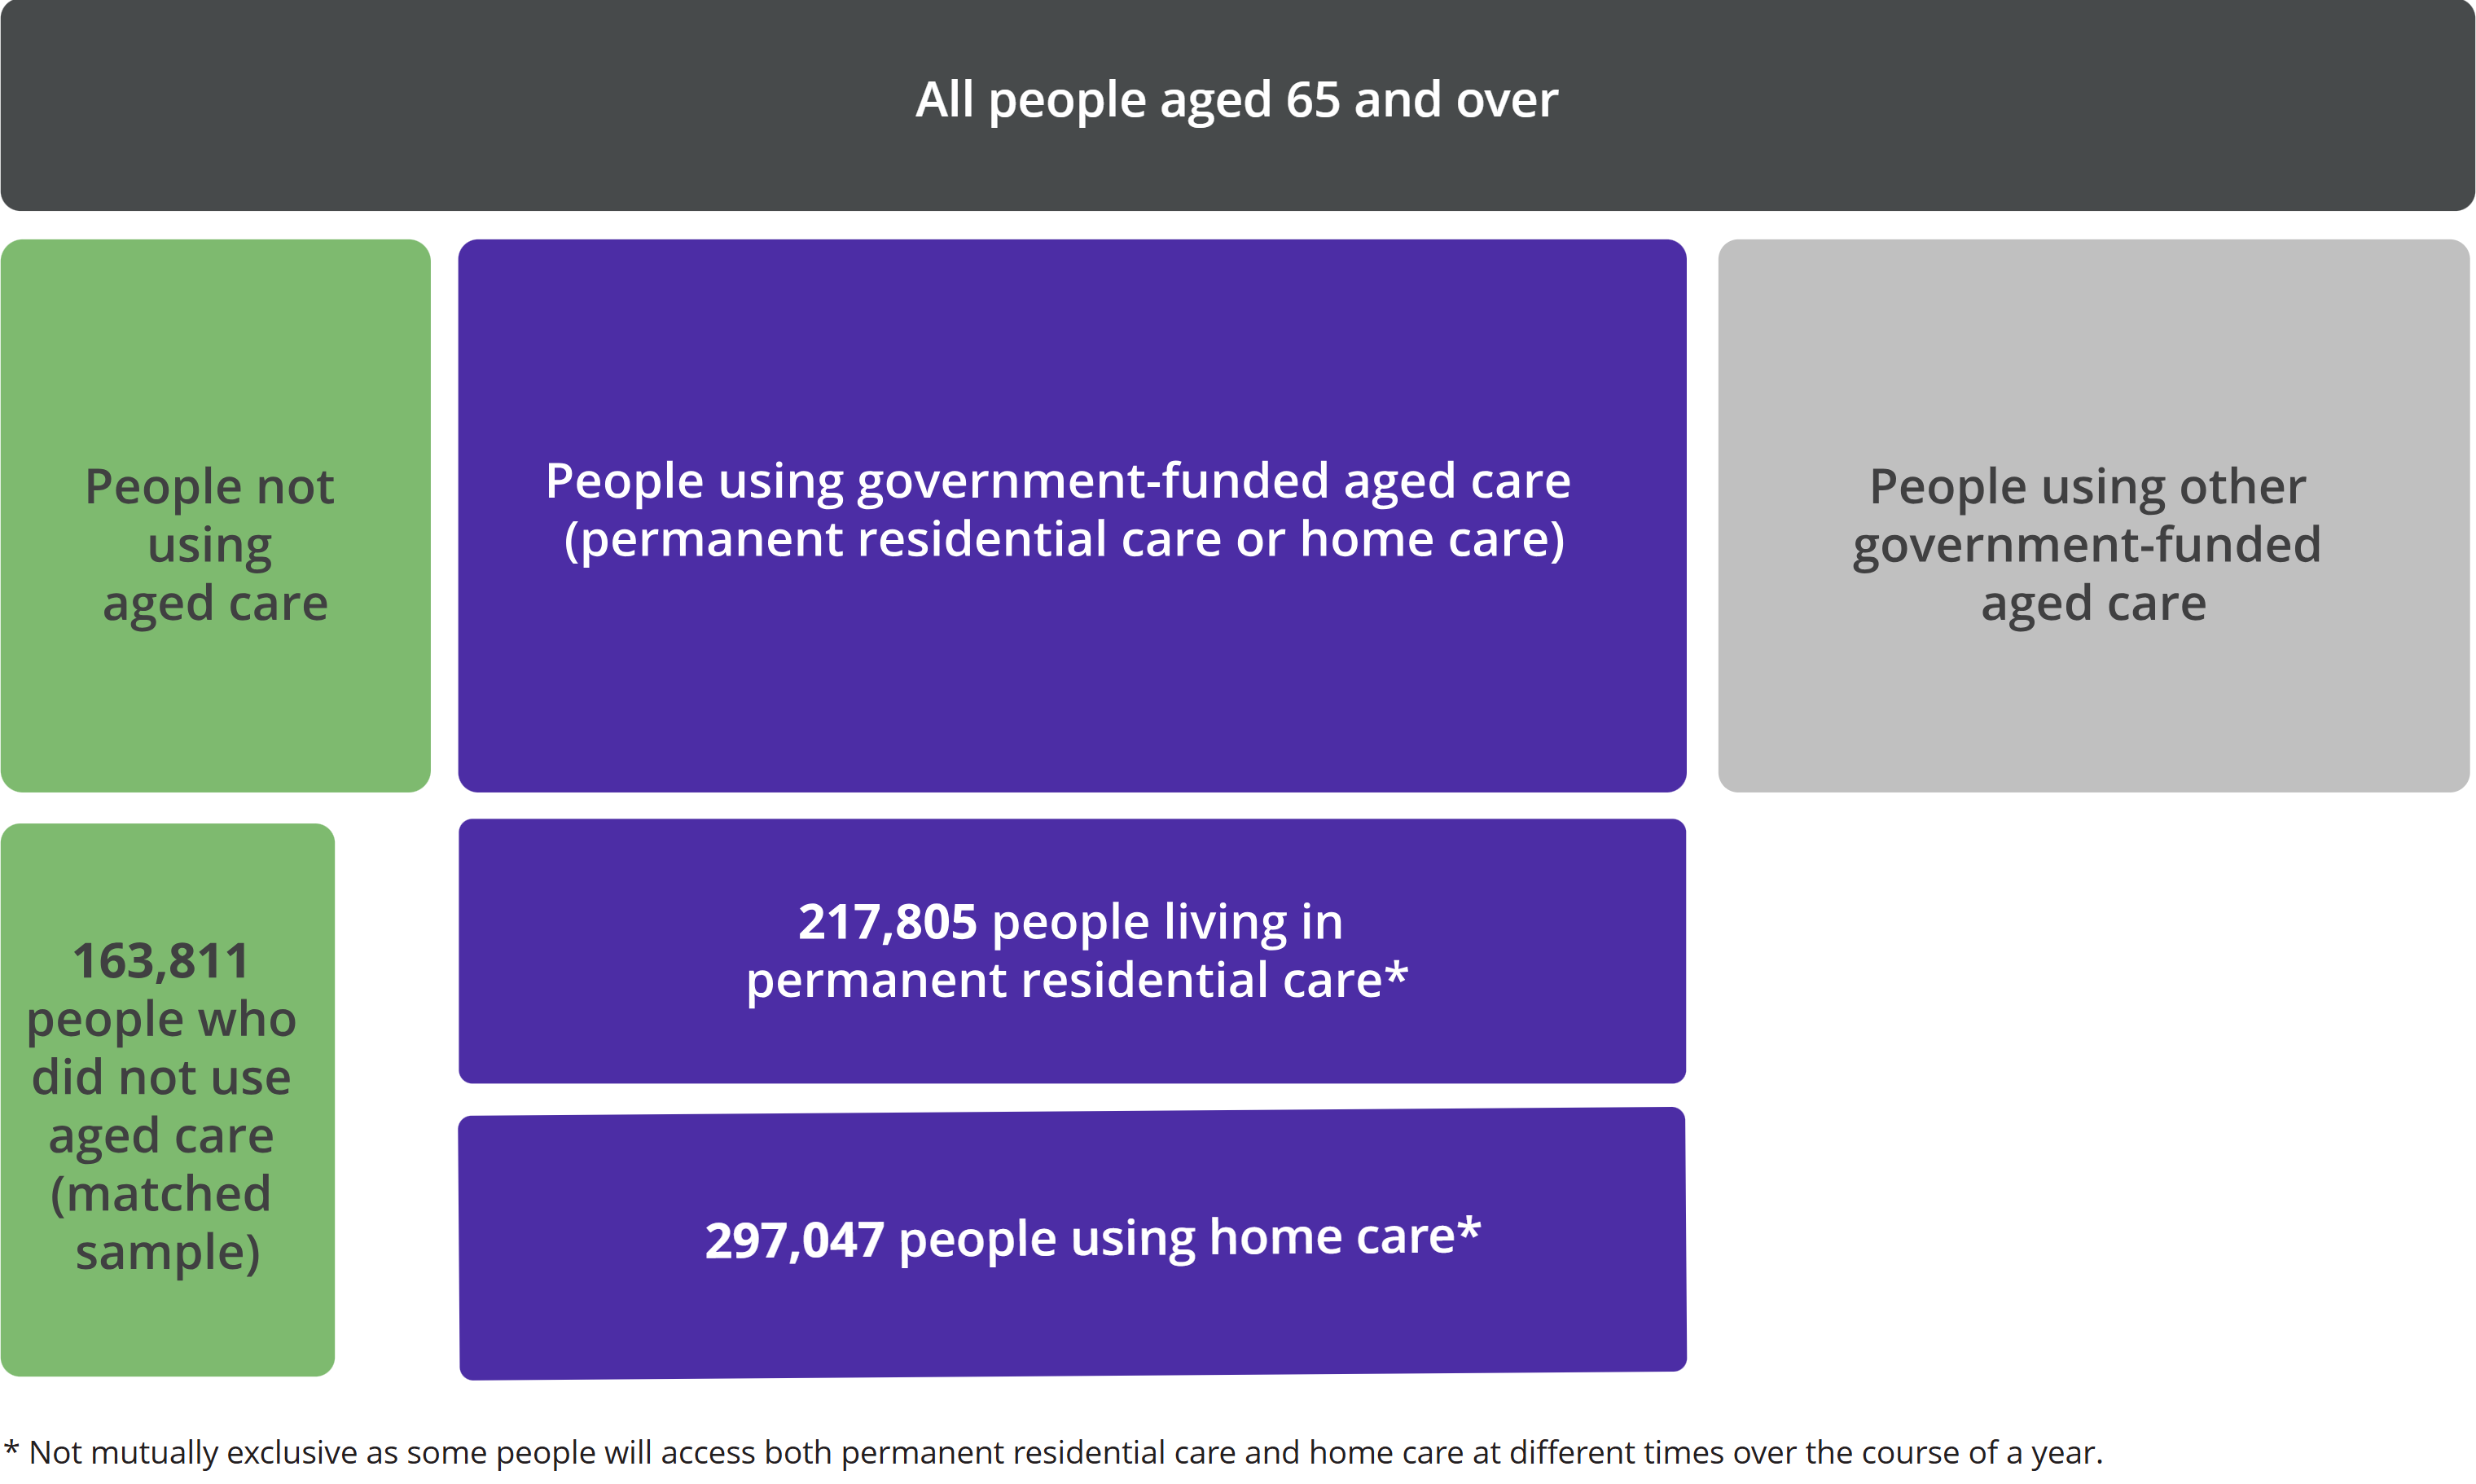
The study population for 2023–24 includes 3 groups aged 65 and over (Figure 1):
- 218,000 people living in permanent residential care
- 297,000 people using home care
- 164,000 people who did not use any aged care services
The ‘no aged care’ group consists of a sample of people from the general population who were matched by an index of age and sex to the aged care recipient groups.
Figure 1: Study population of people aged 65 years and over in 2023–24
 Source: AIHW analysis of the National Aged Care Data Asset (2026)
In 2023–24:
- People using home care were younger on average than people living in permanent residential care – of those using home care, 37% were aged 85 and over compared with 57% of people living in permanent residential care.
- Women made up 64% of people living in permanent residential care and 64% of people using home care.
- The percentage of people living in permanent residential care who were women rose steadily with age, from 46% of those aged 65-69 years to 74% of those aged 90 years and over. By comparison, the percentage of people using home care who were women was similar across age groups.
- Around two-thirds of people in each of the aged care user groups were living in major cities, while only around 1% in each group were living in remote or very remote areas.
For further data on the characteristics of the study population, see Data tables.
Medicare-subsidised service use
This section looks at services where a rebate (subsidy) under the Medicare Benefits Schedule (MBS) was claimed. This includes things like visits or consultations with a general practitioner (GP attendances) or a specialist (specialist attendance).
Patterns of GP attendances and specialist attendances in 2023–24 are outlined in Table 1. The measure ‘person-year’ allows rates to be compared while taking into account how long each person used a certain type of aged care. One person-year is equivalent to one person being in an aged care user group for one full year.
Table 1: Use of Medicare-subsidised GP attendances and specialist attendances by aged care user group, 2023–24
|
|
Permanent residential care |
Home care |
No aged care |
|
People with at least one GP attendance (%) |
96.7 | 97.8 | 79.3 |
| Number of GP attendances per person-year (rate) | 29.6 | 17.9 | 8.2 |
| People with at least one specialist attendance (%) | 41.2 | 68.3 | 51.4 |
| Number of specialist attendances per person-year (rate) | 3.7 | 6.6 | 2.8 |
Source: AIHW analysis of the National Aged Care Data Asset (2026).
In 2023–24:
- People living in permanent residential care had a higher rate of GP attendances compared with people using home care, but a much lower rate of specialist attendances (Table 1).
- People living in permanent residential care had a higher rate of Enhanced Primary Care GP attendances (2.2 services per person-year) compared with people using home care (0.6 per person-year) or no aged care services (0.3 per person-year). Enhanced Primary Care GP attendance refers to a range of services such as health assessments, medication management reviews, and chronic disease management plans.
- People using home care had a higher rate of diagnostic imaging services (4.1 services per person-year) compared with people living in permanent residential care or no aged care services (1.7 and 2.0 per person-year, respectively).
- People using permanent residential care or home care had a higher rate of pathology tests (14.2 and 17.1 services per person-year, respectively) compared with those not using aged care services (7.7 per person-year).
- The oldest age groups tended to have lower rates of Medicare-subsidised service use. For example, people aged 90 and over living in permanent residential care accessed 59.3 services per person-year compared with 71.9 services for those aged 65-69 years.
Mental health services
Medicare-subsidised mental health services are delivered by GPs, psychiatrists, psychologists and other registered allied health professionals. For GPs and psychiatrists, this includes the preparation and review of Mental Health Treatment Plans.
In 2023–24:
- A greater percentage of people using home care had at least one mental health service (7%) compared with those living in permanent residential care (3%) or not using aged care services (2%).
- Among people living in permanent residential care, psychiatrist services were the most common mental health service (59% of services), followed by GP services (21%). Psychiatrist services were also the most common mental health service for people using home care or no aged care services, but made up a smaller percentage overall (37% and 31% of services, respectively).
- Across the 3 aged care user groups, people living in major cities had higher rates of mental health service use compared with people living in regional or remote areas.
For more information on the prevalence of mental health conditions and deaths due to self-injury among aged care service users, see Mental health in aged care.
For further definitions and data on Medicare-subsidised service use by aged care user group and other characteristics, see Data tables.
Prescription medicines dispensed
This section looks at prescription medicines subsidised under the PBS or RPBS. These medicines are typically prescribed by a doctor and provided by a pharmacist. Medicines purchased over the counter or provided in a hospital are not included.
Patterns of prescriptions dispensed in 2023–24 by medicine type are shown in Figure 2. The measure ‘person-year’ allows rates to be compared while taking into account how long each person used a certain type of aged care. One person-year is equivalent to one person being in an aged care user group for one full year.
Figure 2: Rate of prescriptions dispensed per person-year by medicine type and aged care user group, 2023–24
Bar charts compare the rate of prescriptions dispensed per person-year between aged care user groups for each medicine type for the financial year 2023-24
In 2023–24:
- Nearly all people receiving permanent residential care or home care had at least one prescription medicine dispensed under the PBS or RPBS (both 99%), compared with 80% of those in the ‘no aged care’ group.
- People living in permanent residential care had a slightly higher overall rate of prescriptions dispensed (81.3 prescriptions dispensed per person-year) compared with people using home care (77.6 per person-year), and a much higher rate compared with those not using aged care services (32.5 per person-year).
- People living in permanent residential care had higher rates of antipsychotics, benzodiazepines and opioids dispensed to them compared with people using home care (Figure 2).
- The rate of antibiotic dispensing was similar for people living in permanent residential care (3.8 prescriptions dispensed per person-year) and those using home care (3.3 per person-year). This was a higher rate compared with the ‘no aged care’ group (1.2 per person-year).
For further definitions and data on prescription medicines dispensed by aged care user group and other characteristics, see Data tables.
Hospitalisations
This section looks at episodes of admitted patient care, where a person is formally admitted to hospital. The data are based on separations, meaning completed episodes of care. Hospital separations can be a total hospital stay (e.g. from admission to discharge home) or a portion of a hospital stay (e.g. where a person is transferred to a different hospital). Overnight separations mean the episode of care involved at least 1 night in hospital.
Patterns of hospitalisations in 2023–24 are outlined in Table 2. Hospitalisations were analysed only for people living in and hospitalised in New South Wales, Victoria, Queensland, Tasmania and the Australian Capital Territory. Data from other jurisdictions were not available for analysis. The measure ‘person-year’ allows rates to be compared while taking into account how long each person used a certain type of aged care. One person-year is equivalent to one person being in an aged care user group for one full year.
Table 2: Hospitalisations (separations) by aged care user group, 2023–24
|
|
Permanent residential care |
Home care |
No aged care |
|
People with at least one hospitalisation (%) |
43.0 |
51.8 |
24.4 |
| Number of hospitalisations per person-year (rate) |
1.6 |
2.8 |
0.6 |
| Hospitalisations that were overnight separations (% of total) |
61.9 |
43.6 |
41.6 |
| Hospitalisations for acute care (% of total) |
87.0 |
90.8 |
94.0 |
| Hospitalisations for rehabilitation care (% of total) |
2.7 |
3.9 |
3.1 |
Source: AIHW analysis of the National Aged Care Data Asset (2026).
In 2023–24:
- People using home care had a higher rate of hospitalisations compared with those living in permanent residential care or the ‘no aged care’ group (Table 2).
- Hospitalisations among people living in permanent residential care more often involved an overnight stay (62% of hospitalisations) compared with people using home care or no aged care services (44% and 42% of hospitalisations, respectively) (Table 2).
- Among people living in permanent residential care, 16% of overnight hospitalisations were due to Injury, poisoning and certain other consequences of external causes, compared with 14% for those using home care and 12% for those not using aged care services.
- People living in remote and very remote areas had higher rates of hospitalisations compared with those living in major cities or regional areas, among both the permanent residential care and home care groups
For further definitions and data on hospitalisations by aged care user group and other characteristics, see Data tables.
Emergency department presentations
Some hospitals provide urgent medical care through dedicated 24-hour emergency departments (EDs). An ED presentation is recorded after a person arrives at the ED and they are registered clerically or triaged.
Patterns of ED presentations in public hospitals in 2023–24 are outlined in Figure 3. ED presentations were analysed only for people living in and presenting to EDs in New South Wales, Victoria, Queensland, Tasmania and the Australian Capital Territory. Data from other jurisdictions were not available for analysis. The measure ‘person-year’ allows rates to be compared while taking into account how long each person used a certain type of aged care. One person-year is equivalent to one person being in an aged care user group for one full year.
Figure 3: ED presentations by aged care user group, 2023–24
Bar charts compare the percentage of people in each aged care user group that have 0, 1, 2-3 and 4 or more ED presentations in the financial year 2023-24
In 2023–24:
- People living in permanent residential care and those using home care had higher rates of ED presentations (1.1 and 1.3 ED presentations per person-year, respectively) compared with those in the ‘no aged care’ group (0.3 per person-year).
- ED presentations more often concluded with an admission to hospital among people living in permanent residential care (68% of ED presentations) compared with people using home care (63% of ED presentations) or no aged care services (52% of ED presentations).
- Among people living in permanent residential care, 18% of ED presentations were due to Injury, poisoning and certain other consequences of external causes, compared with 13% for those using home care and 15% for those not using aged care services.
- Men had higher rates of ED presentations than women across all 3 aged care user groups. For example, men living in permanent residential care had 1.5 ED presentations per person-year compared with 0.9 per person-year for women living in permanent residential care.
For further definitions and data on ED presentations by aged care user group and other characteristics, see Data tables.
Health service use over time
This section looks at trends over time in health service use over the period 2021–22 to 2023–24. These trends should be interpreted descriptively, as the health needs of people accessing aged care in a given year can change over time. Data for hospitalisation and ED presentations are not currently included for 2021–22 but will be added in future.
Figure 4: Health service use by aged care user group, between 2021–22 and 2023–24
Line charts compare changes in rates of Medicare-subsidised services, prescriptions dispensed, hospitalisations and ED presentations between aged care user groups from 2021–22 to 2023–24
Between 2021–22 and 2023–24:
- The number of people using home care increased by 28% (from 232,000 to 297,000), while the number of people living in permanent residential care increased only slightly (from 215,000 to 218,000). Demographic characteristics (sex, age group and remoteness) did not change substantially over time.
- Rates of MBS-subsidised GP attendances decreased among those using home care and the 'no aged care’ group, but remained stable for those living in permanent residential care. Rates of MBS-subsidised specialist attendances did not change substantially for any aged care user group (Figure 4).
- The rate of MBS-subsidised pathology tests decreased among all groups, particularly for those living in permanent residential aged care (from 18.4 to 14.2 services per person-year).
- Rates of antipsychotics, benzodiazepines, opioids and antibiotics dispensed under the PBS or RPBS remained stable over time among all aged care user groups.
- Overall rates of hospitalisations and ED presentations did not change substantially for any of the aged care user groups between 2022–23 and 2023–24.
For further definitions and data on health service use over time by aged care user group and other characteristics, see Data tables.
Where can I find out more?
This topic page uses data from the National Aged Care Data Asset (NACDA). The NACDA brings together de-identified person-level data collected across aged care, health and community service settings for aged care research purposes.
For more information on scope, linkage rates and other data characteristics for the NACDA, see NACDA: Data resource profile.
The NACDA is available for both government and non-government researchers to access via the National Health Data Hub (NHDH). The key steps for NHDH access are:
- Eligibility – check the project aligns with eligibility requirements and approved uses for the NHDH.
- Ethics – most non-government projects require an additional Human Research Ethics Committee (HREC) approval (see NHDH frequently asked questions).
- Proposal – submit a project proposal to [email protected] (see NHDH Resources for template).
- Approval – AIHW facilitate approvals from the NHDH data custodian, the AIHW Ethics Committee delegate and the NHDH Advisory Committee.
- Onboarding – researchers complete NHDH onboarding training (conducted monthly) before they can access data through the secure access environment.
For more information, see NHDH researcher access, eligibility & costs.
The aged care system offers a continuum of care under 3 main types of service:
- Commonwealth Home Support Program (home support) provides entry-level services focused on supporting individuals to undertake tasks of daily living to enable them to be more independent at home and in the community.
- Home Care Packages Program (home care) was a more structured, comprehensive package of home-based support, provided over 4 levels. The Home Care Packages Program was replaced by the Support at Home Program on 1 November 2025.
- Residential aged care (permanent residential care) provides 24-hour care and accommodation for older people who are unable to continue living independently in their own home and need assistance with everyday tasks.
There are also several types of short-term or flexible care, and services for specific population groups available that extend across the spectrum from home support to residential care.
For more information on aged care services in Australia see the Report on the Operation of the Aged Care Act, or visit the Department of Health, Disability and Ageing website.
Data tables
GEN interfaces - Profile of the study population 2022-23 - Data tables – May 2026
(XLSX, 289 KB)
GEN interfaces - Profile of the study population 2023-24 - Data tables – May 2026
(XLSX, 290 KB)
GEN interfaces - Medicare-subsidised service use 2022-23 - Data tables - May 2026
(XLSX, 391 KB)
GEN interfaces - Medicare-subsidised service use 2023-24 - Data tables - May 2026
(XLSX, 401 KB)
GEN interfaces - Prescription medicines dispensed - Data tables 2022-23 - May 2026
(XLSX, 347 KB)
GEN interfaces - Prescription medicines dispensed - Data tables 2023-24 - May 2026
(XLSX, 347 KB)
GEN interfaces - Hospitalisations - Data tables 2022-23 - May 2026
(XLSX, 412 KB)
GEN interfaces - Hospitalisations - Data tables 2023-24 - May 2026
(XLSX, 411 KB)
GEN interfaces - Emergency department presentations - Data tables 2022-23 - May 2026
(XLSX, 338 KB)
GEN interfaces - Emergency department presentations - Data tables 2023-24 - May 2026
(XLSX, 339 KB)
Previous releases
GEN topic page: Interfaces between the aged care and health systems (2021–22)
(PDF, 517 KB)
GEN topic page: Interfaces between the aged care and health systems (2021–22) – Supplementary tables
(ZIP, 660 KB)
GEN topic page: Interfaces between the aged care and health systems (2016–17)
(PDF, 532 KB)
GEN topic page: Interfaces between the aged care and health systems (2016–17) – Supplementary tables
(XLSX, 613 KB)
Publications and data
-
Single Assessment System (SAS) quarterly needs assessment data report: 1 October – 31 December 2025
-
Single Assessment System (SAS) quarterly needs assessment data report: 1 January – 31 March 2026
-
National Aged Care Data Asset: Data resource profile
-
Health outcomes in aged care residents with dementia during the COVID-19 pandemic
-
Specialist palliative care use for older people receiving aged care
