Residential Aged Care Quality Indicators — April to June 2023
Quality indicators (QI) measure aspects of service provision that contribute to the quality of care given by residential aged care services (RACS). Since 1 July 2019, participation in the National Aged Care Mandatory Quality Indicator Program (QI Program) has been a requirement for all Australian Government-subsidised RACS. Until 30 June 2021, the QI Program included 3 QIs (pressure injuries, use of physical restraint, unplanned weight loss). On 1 July 2021, the QI Program expanded to include 5 QIs:
- Pressure injuries
- Use of physical restraint
- Unplanned weight loss
- Falls and major injury
- Medication management
On 1 April 2023, the QI Program was further expanded to include 6 new QIs:
- Activities of daily living
- Incontinence care
- Hospitalisations
- Workforce
- Consumer experience
- Quality of life
Details about these new indicators can be found in the National Aged Care Mandatory Quality Indicator Program Manual 3.0 – Part A (QI Program Manual). The suite of 6 new indicators will be included in quarterly reporting from the July–September 2023 quarter and in the 2023–24 Annual Report. Baseline data for two of these new indicators, as well as data quality checking, are required before meaningful reporting is possible.
While the original QI Program (1 July 2019) counted occurrences of pressure injuries, unplanned weight loss and use of physical restraint devices (meaning that more than one pressure injury or physical restraint device could be counted for a single care recipient), the expanded QI Program from 1 July 2021 counts the number of care recipients meeting/not meeting QI criteria and produces prevalence rates in the form of percentages. This value is calculated by dividing the number of eligible care recipients that meet the criteria to be counted for the QI by the total number of eligible care recipients assessed and then multiplying by 100.
Not all care recipients are counted in each QI measurement. Care recipients may be excluded from QIs for various reasons, such as not consenting to being assessed or have their data collected (for applicable QIs), being absent from the service during the QI assessment period or receiving end-of-life care. Consent is required from care recipients for the purposes of two QIs included in this report: unplanned weight loss and pressure injuries. The reasons for other exclusions differ by QI and are detailed in the QI Program Manual . The care recipients eligible to contribute to QI measurements are those in the total care recipient population who remain after subtracting ineligible care recipients (including those that do not provide consent).
Most QIs in this report are measured during specified assessment windows (e.g. use of physical restraint is assessed during a review of three days of records in the quarter). The results for some QIs may therefore not represent the occurrence of those events across other, non-assessed periods in the quarter. Further detail on each QI, including its rationale and measurement, can be found in the QI Program Manual. More information on the QI Program is available from the Department of Health and Aged Care.
This quarterly report includes QI measurements from data collected from 1 April to 30 June 2023 for 2,387 residential aged care services (RACS) conducted under the expanded QI Program (National Aged Care Mandatory Quality Indicator Program Manual 3.0). These RACS are those that had received Australian Government subsidies for delivering care, services, and accommodation in that period; had submitted QI data by the due date (21 July 2023); and had not amended these data by the date of QI data extraction (29 August 2023). Data processing, checking, and preparing the data for transfer was completed by the Department of Health and Aged Care between the submission and extraction dates.
Analysis was completed by AIHW on 6 September 2023, after which a period of statistical and content reviews was undertaken within the AIHW and by the Department of Health and Aged Care up to the point of embargo and publication. Available data represented 90% of the 2,648 RACS that received these government subsidies in the quarter (less than the previous quarter). Further detail on the care recipient coverage of the QI Program in this quarter, including counts of care recipient measurements and exclusions for each QI, is presented in Table 1 of the Technical notes.
Definitions of quality indicators included in this report
...
A pressure injury is a localised injury to the skin and/or underlying tissue usually over a bony prominence, because of pressure, shear, or a combination of these factors. Assessment of pressure injuries in eligible care recipients is made on or around the same time and day in each quarter of the year. This can be done as part of the care recipient’s usual personal care. Consent is sought from care recipients before a full-body observation assessment is undertaken.
Eligible care recipients with one or more pressure injuries are reported against each of the six pressure injury stages:
- Stage 1 pressure injuries: intact skin with non-blanchable redness of a localised area.
- Stage 2 pressure injuries: partial-thickness skin loss presenting as a shallow open ulcer with a red/pink wound bed.
- Stage 3 pressure injuries: full-thickness skin loss, no exposure of bone, tendon or muscle.
- Stage 4 pressure injuries: full-thickness loss of skin and tissue with exposed bone, tendon or muscle.
- Unstageable pressure injuries: full-thickness skin tissue loss in which the base of the injury is covered by slough (yellow, tan, grey, green or brown) and/or eschar (tan, brown or black).
- Suspected deep tissue injuries: purple or maroon localised area of discoloured intact skin or blood-filled blister due to damage of underlying soft tissue from pressure and/or shear.
Additional reporting: Eligible care recipients with pressure injuries that were acquired outside of the service during the quarter are counted separately but are still included in the total number of care recipients reported as having pressure injuries.
The Quality of Care Principles 2014 (Quality of Care Principles) define restrictive practices as any practice or intervention that has the effect of restricting the rights or freedom of movement of a care recipient.
The QI Program use of physical restraint indicator measures and reports data relating to all restrictive practice, excluding chemical restraint. This includes physical restraint, mechanical restraint, environmental restraint and seclusion.
It is a legal requirement for RACS to document all instances of physical restraint (see Part 4A of the Quality of Care Principles). For this QI in each quarter, three days of existing records for all eligible care recipients at a service are assessed for any instances of physical restraint. This indicator is therefore a measure of the use of physical restraint across the three-day period only. This three-day period is selected and recorded by providers but must be varied each quarter and not known to the staff directly involved in care.
Use of physical restraint are still recorded even if a care recipient or their representative has provided consent for the use of the restraint.
Additional reporting: Eligible care recipients physically restrained exclusively through the use of a secure area are counted separately but are still included in the total number of care recipients reported as being physically restrained.
Weight loss is considered to be unplanned where there is no written strategy and ongoing record relating to planned weight loss for the care recipient. Eligible care recipients are weighed each month around the same time of the day and wearing clothing of a similar weight (e.g., a single layer without coats or shoes). Consent is sought from care recipients before an assessment on their body weight is undertaken.
This indicator includes two categories:
- Significant unplanned weight loss: Eligible care recipients who experienced significant unplanned weight loss of 5% or more when comparing their current and previous quarter finishing weights.
- Consecutive unplanned weight loss: Eligible care recipients who experienced consecutive unplanned weight loss every month over three consecutive months of the quarter.
A fall is an event that results in a person coming to rest inadvertently on the ground or floor or other lower level. For a fall to meet the criteria of resulting in a major injury, the fall must result in one or more of the following: bone fractures, joint dislocations, closed head injuries with altered consciousness and/or subdural haematoma. Assessment for falls and major injury is conducted through a single review of the care records of each eligible care recipient for the entire quarter.
This indicator includes two categories:
- Falls: Eligible care recipients who experienced a fall (one or more) at the service during the quarter.
- Falls that resulted in major injury: Eligible care recipients who experienced a fall at the service, resulting in major injury (one or more), during the quarter.
Assessment for polypharmacy is conducted through a single review of medication charts and/or administration records for each eligible care recipient for a collection date selected by the service every quarter. For antipsychotics, a seven-day medication chart and/or administration record review is conducted for each eligible care recipient every quarter.
This indicator includes two categories:
- Polypharmacy: Eligible care recipients who were prescribed nine or more medications as at the collection date in the quarter.
- Antipsychotics: Eligible care recipients who received an antipsychotic medication during the seven-day assessment period in the quarter.
Additional reporting: Eligible care recipients who received an antipsychotic medication for a diagnosed condition of psychosis are counted separately but are still reported in the total number of care recipients who received an antipsychotic medication.
National Data: Variation over time
A trend analysis is conducted to examine variation over time in QI performance. For trend analysis, data are pooled together for every eligible care recipient reported about in the quarter. Trends are examined based on sector level outcomes per quarter.
At each quarter, the number of care recipients who meet criteria for a quality indicator is counted. These counts are then compared over time using a quasi-Poisson regression model. More detail about the quasi-Poisson regression model can be found in the Technical Notes.
The trend analysis included data from eight quarters, from July–September 2021 to April–June 2023. Results show that:
- Over time there has been a statistically significant decrease in the proportion of residents experiencing polypharmacy, antipsychotic medication use, falls that result in major injury, use of physical restraint, significant unplanned weight loss and consecutive unplanned weight loss, and;
- Over time there has been no statistically significant change in the proportion of residents experiencing falls or with one or more pressure injuries.
National data
Quality indicator data are presented below at a national level. The table presents data for all eligible care recipients aggregated across all 2,387 included RACS. The boxplot that follows presents data for all eligible care recipients aggregated at the service level. For further information on boxplots, see ‘Interpreting boxplots’ below.
The values shown in the box plots are the minimum value, 25th percentile (‘Lower Hinge’), the 50th percentile (‘Median’), 75th percentile (‘Upper Hinge’) and the maximum value.
As an example of interpreting the percentiles, the 25th percentile shows at what QI prevalence rate 25% of the RACS reported a rate lower than this, and conversely 75% of the RACS reported a QI rate higher than this. The median value represents the QI prevalence rate in the middle of the values reported in Australia.
The interquartile range (IQR) is a measure of statistical dispersion or spread of QI rates and is the difference between the 75th percentile and the 25th percentile values.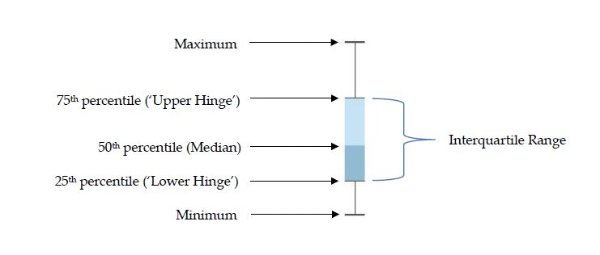
Geographic variation
Disaggregations of QIs by state and territory and by remoteness categories were calculated from raw data with no risk adjustment. It is not possible to take into account variation in the complexity of people’s care needs at the service level (case-mix) nor how this interacts with other features known to vary across geographical areas, such as service size, service ownership or interaction with healthcare services (such as hospitals and palliative care services).